


More than 1,600 companies trust in ForceManager CRM


Accelerate sales activities of your team from the very first day of use.
Log everything automatically.
Just focus on selling
Calls, geolocalized visits, video calls, calendars and emails all integrated.
Know more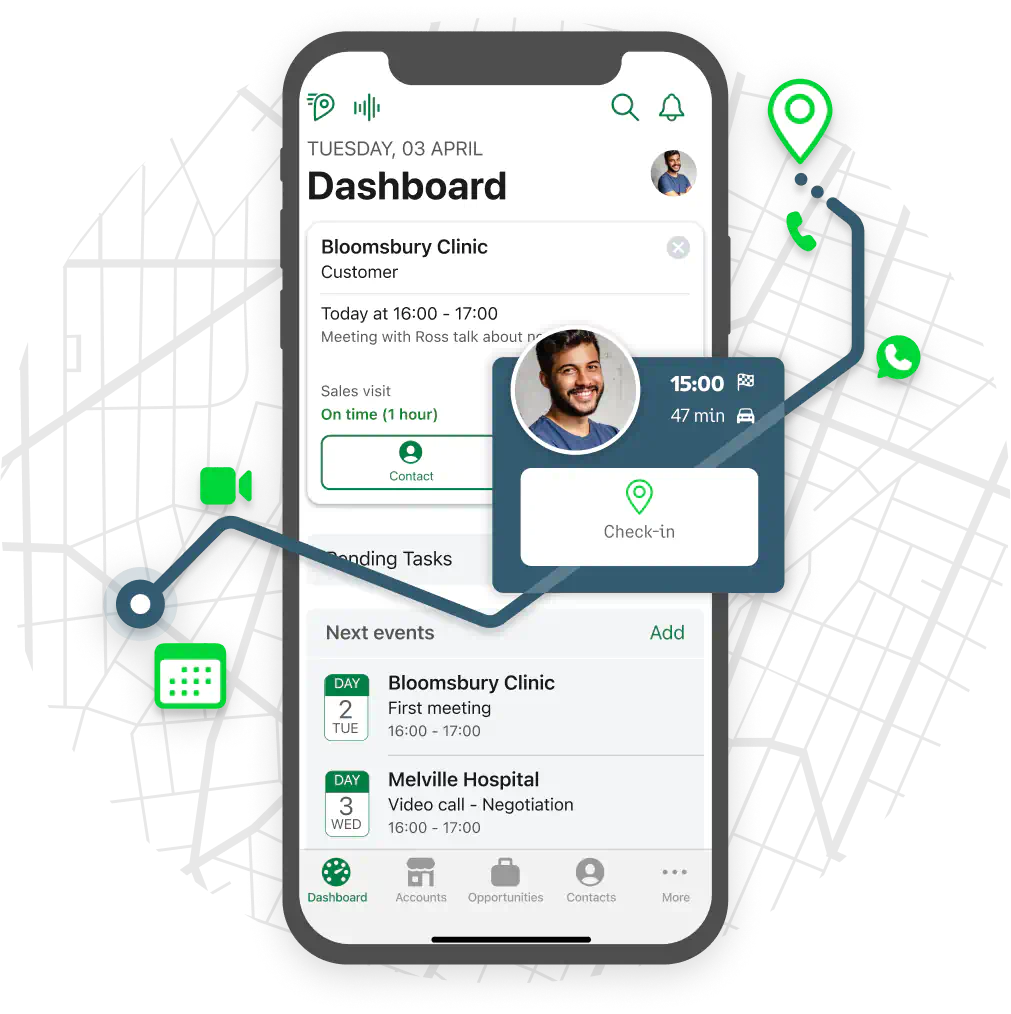
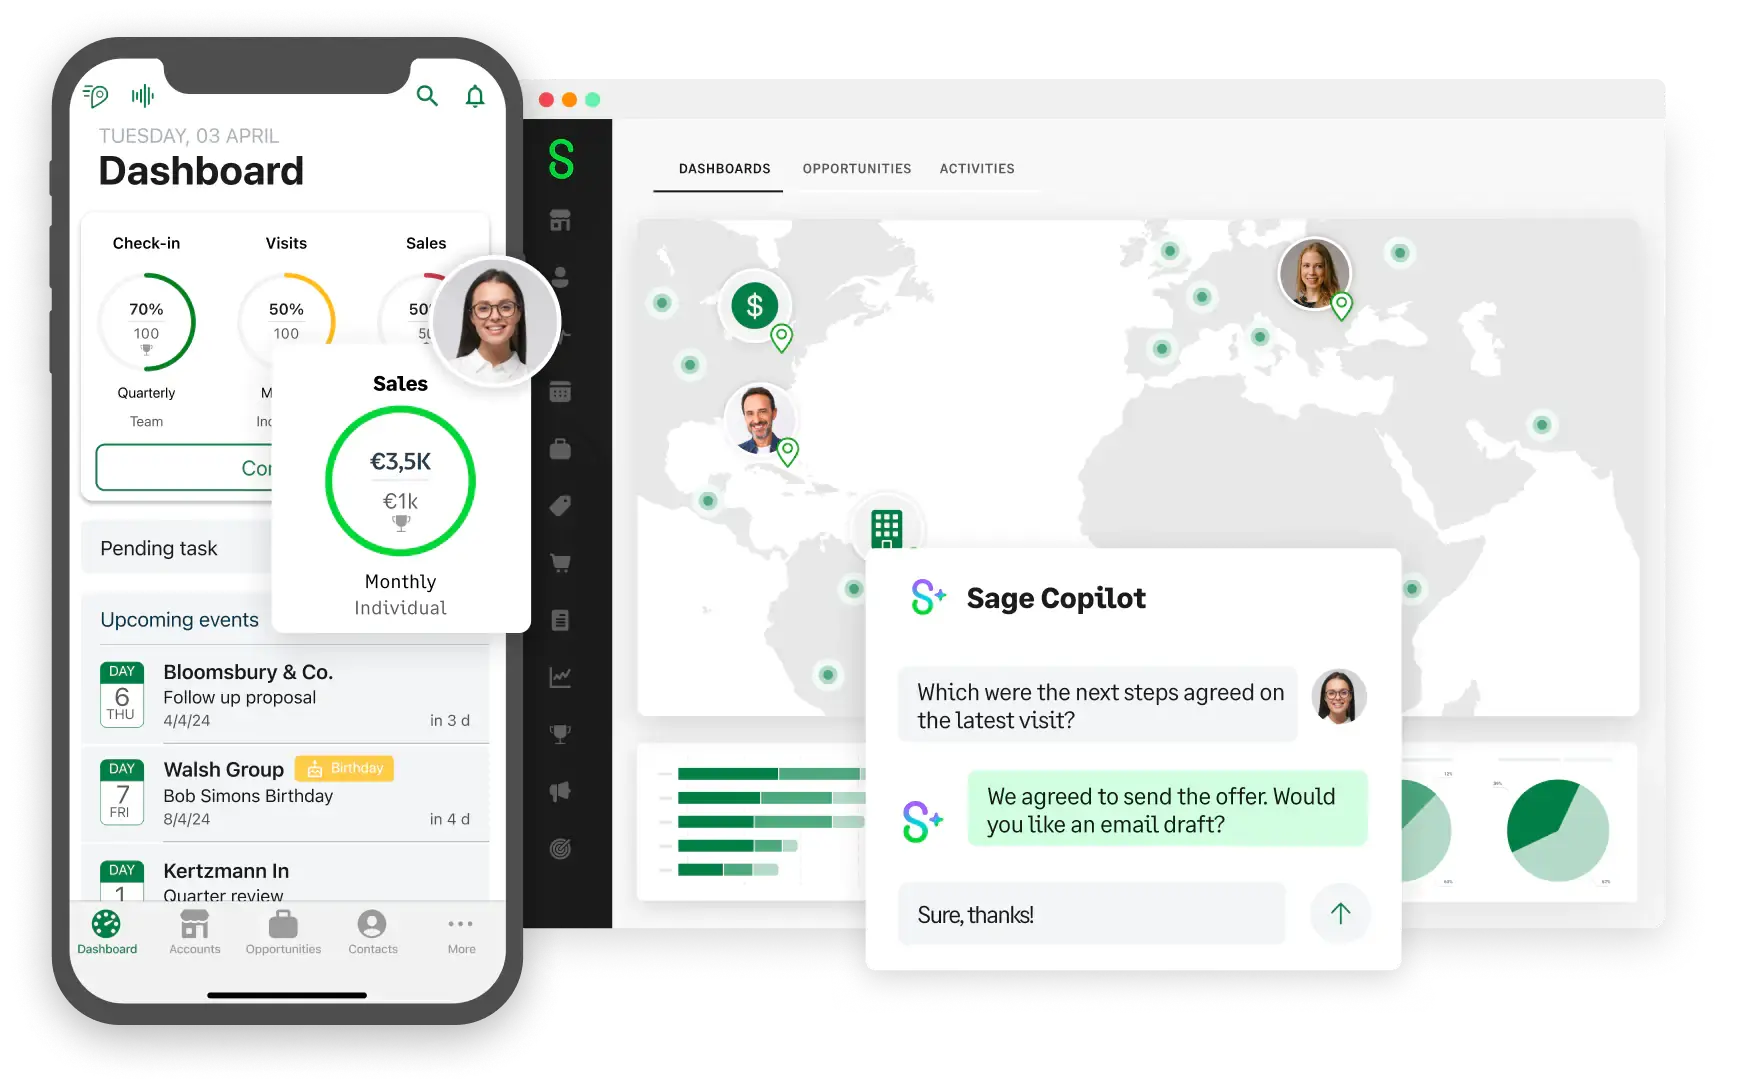
Sell Smarter. The Artificial Intelligence that changes everything.
Enhance your deal analysis, generate actionable sales insights through interactive charts, or extract key negotiation points from email threads. Dana AI, our AI for sales, streamlines your process end-to-end.
Know more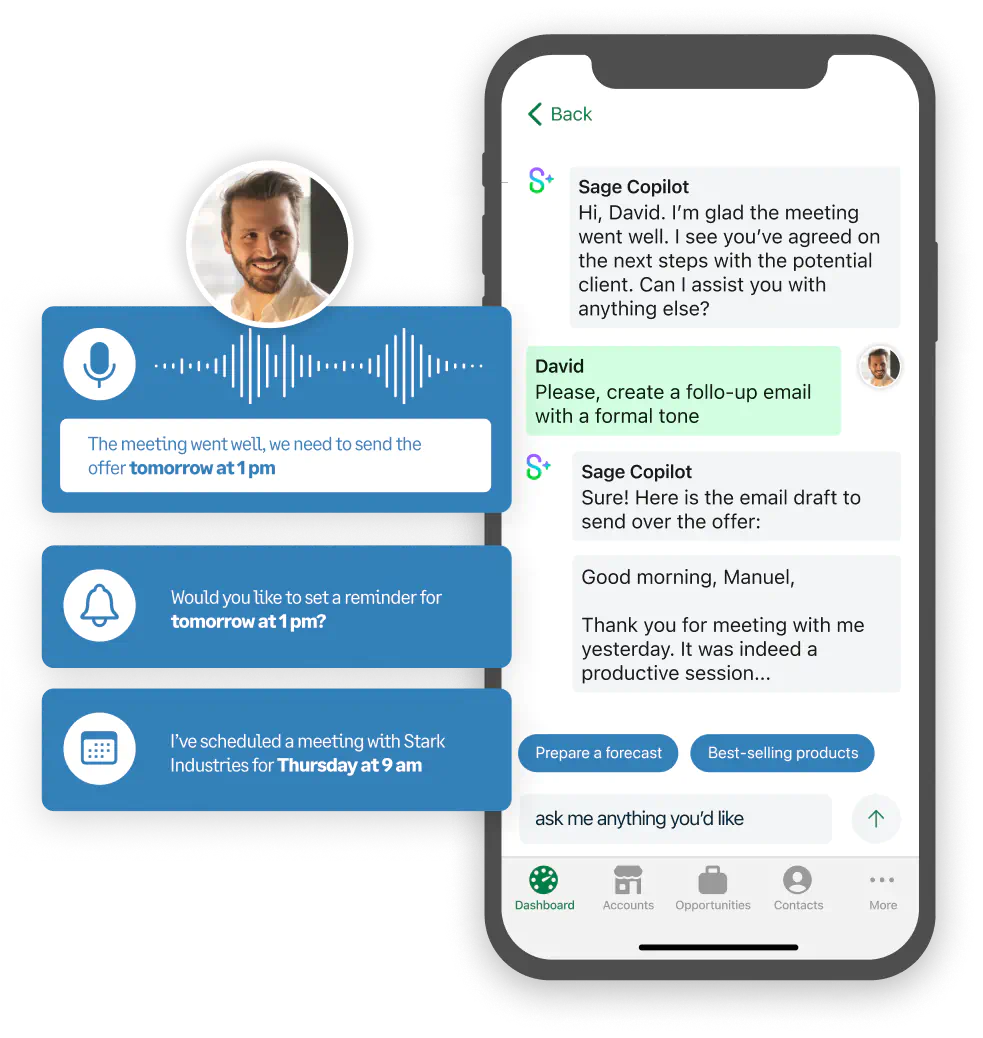
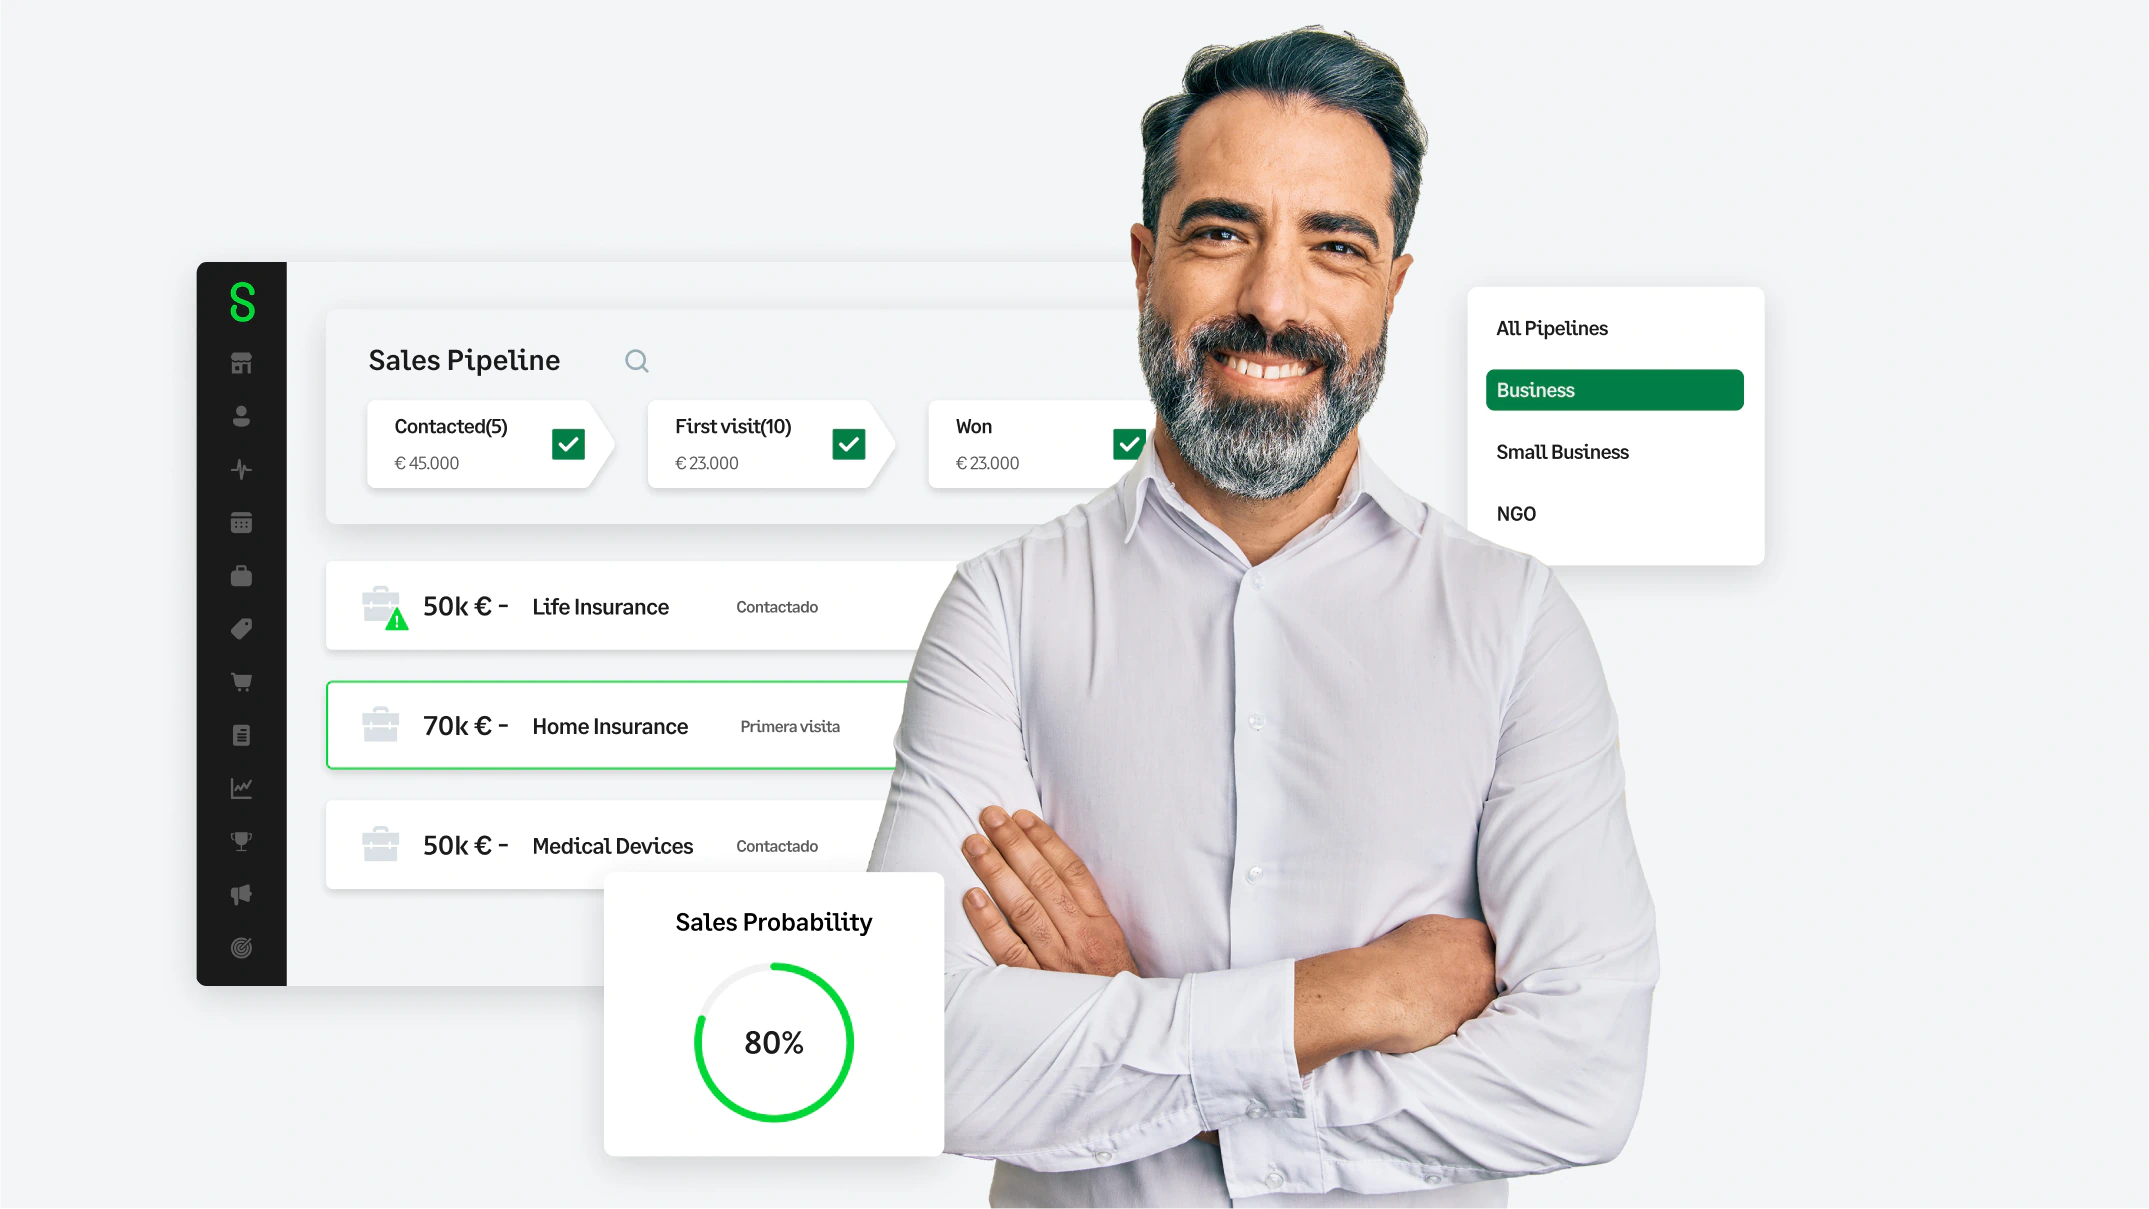
Customers, leads and opportunities.
Collaborate with your team.
Visualize the progress of all opportunities in your team’s pipeline and prioritize tasks. Everything geolocalized and available offline.
Know more
Personalized sales and activity goals. One team target to hit.
Assign customized targets to take your sales team to the next level.
Know more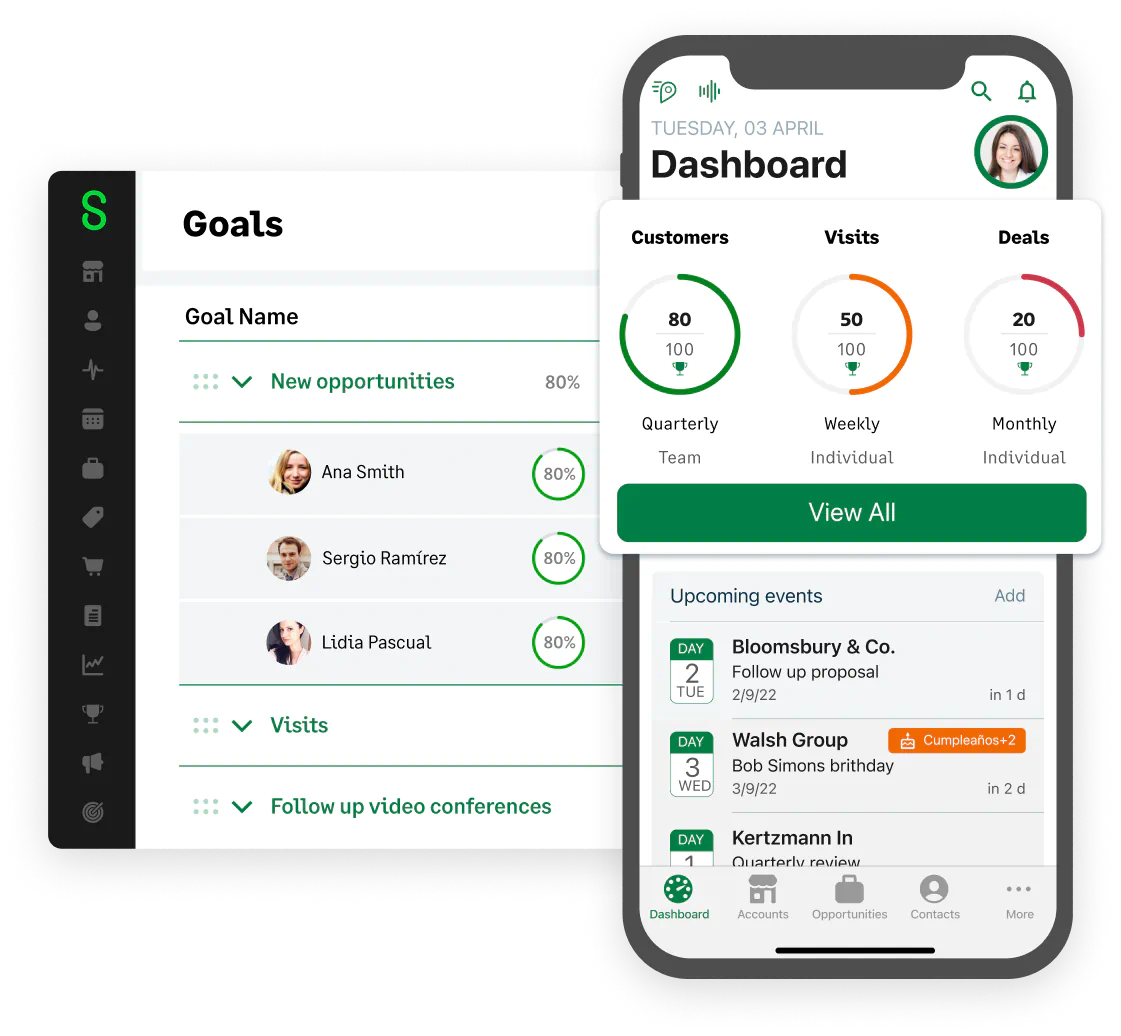
Track activities in real time and accelerate your sales.
Customized reports and widgets to monitor your team's progress and execute your sales strategy.
Know more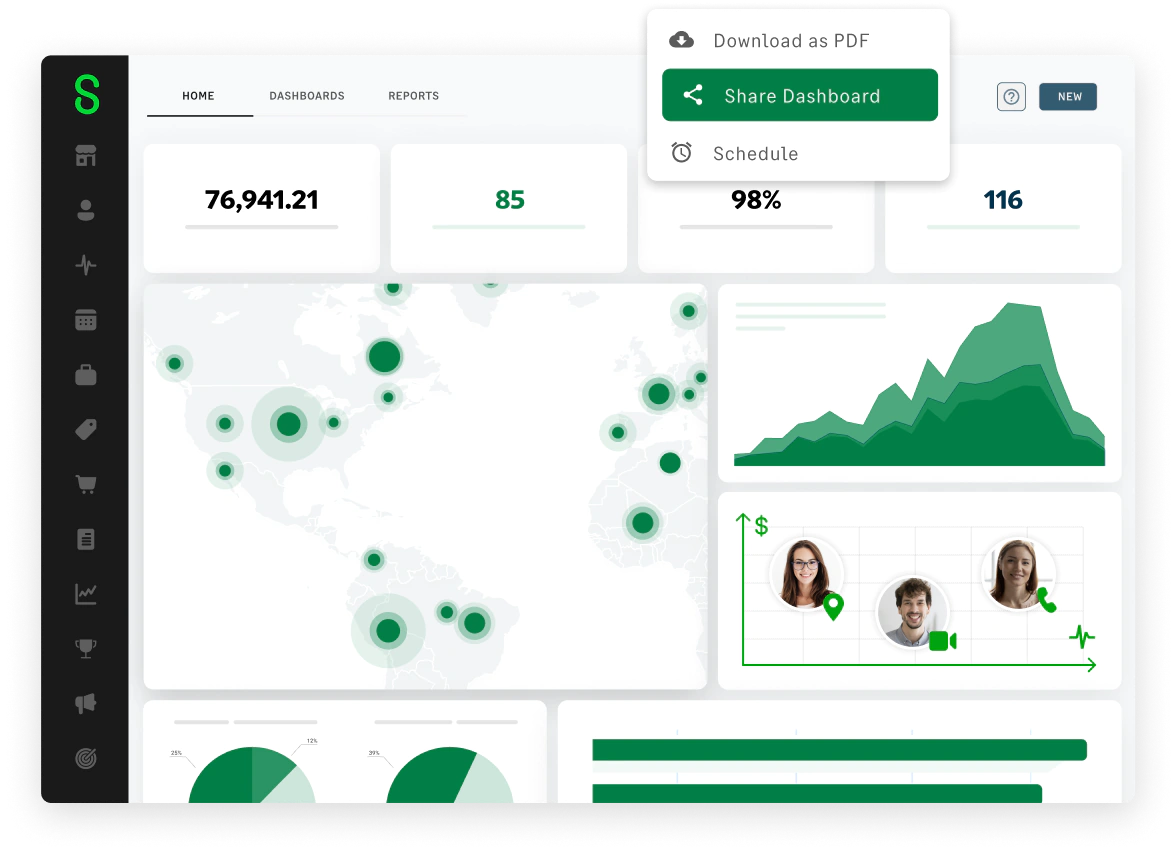
Access your CRM inside Microsoft Teams
Organize video calls and log them automatically. Display key customer history, take notes and more.
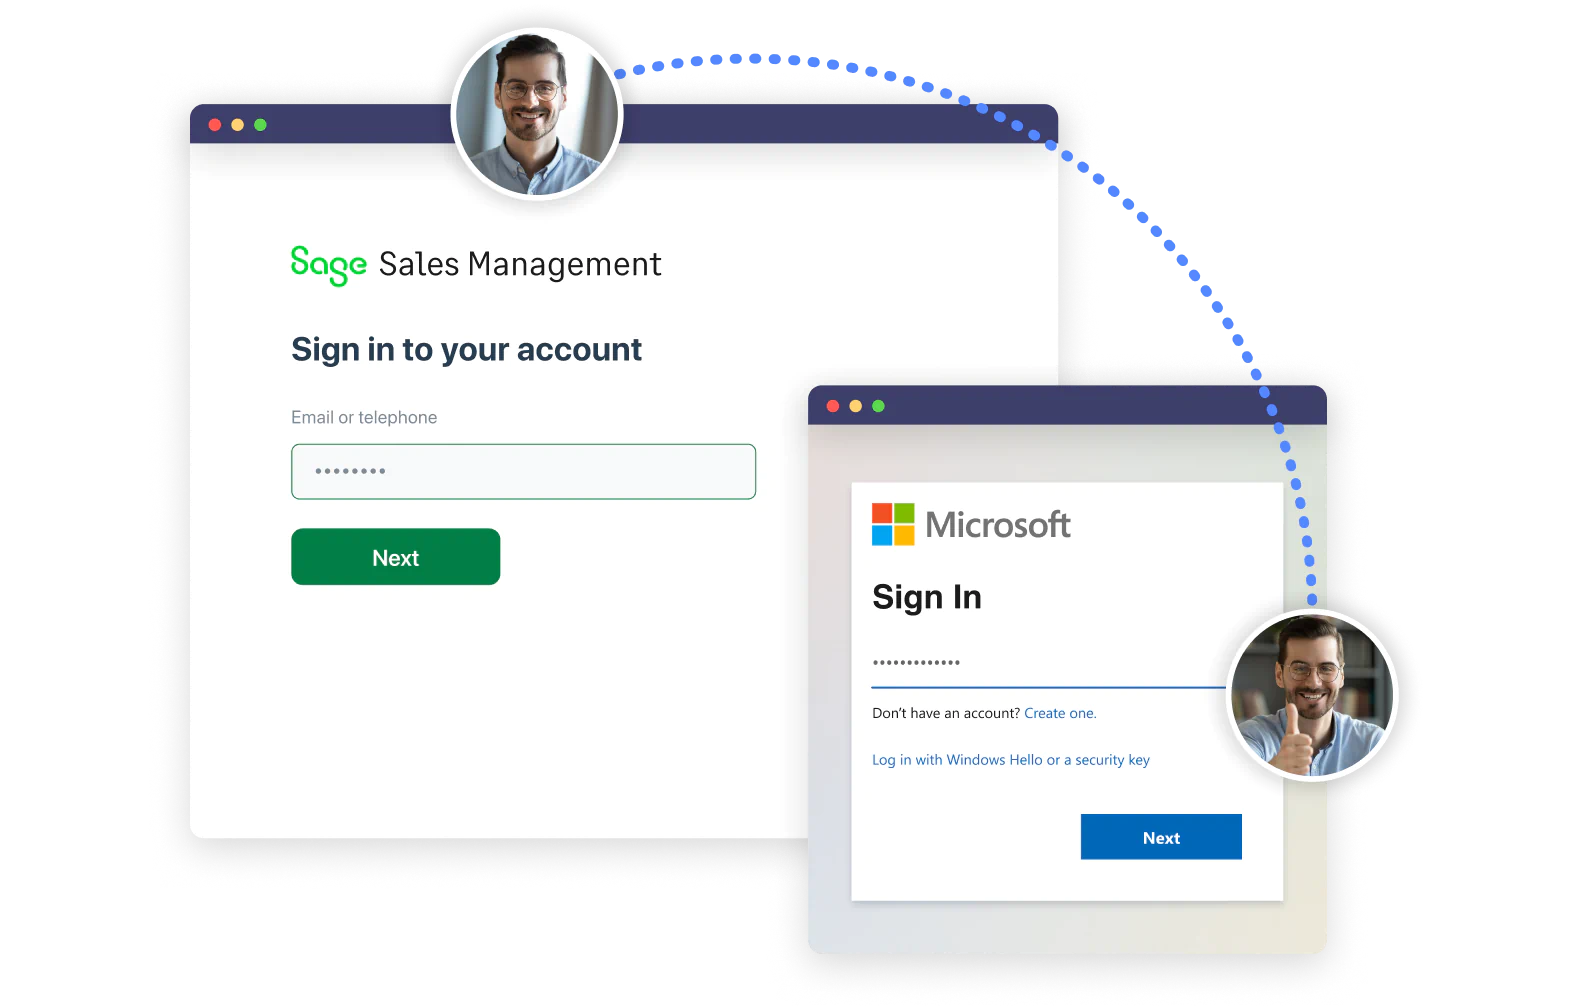
Login with your Microsoft account
Leverage Single Sign-On and allow your team to use their Microsoft accounts for instant access.
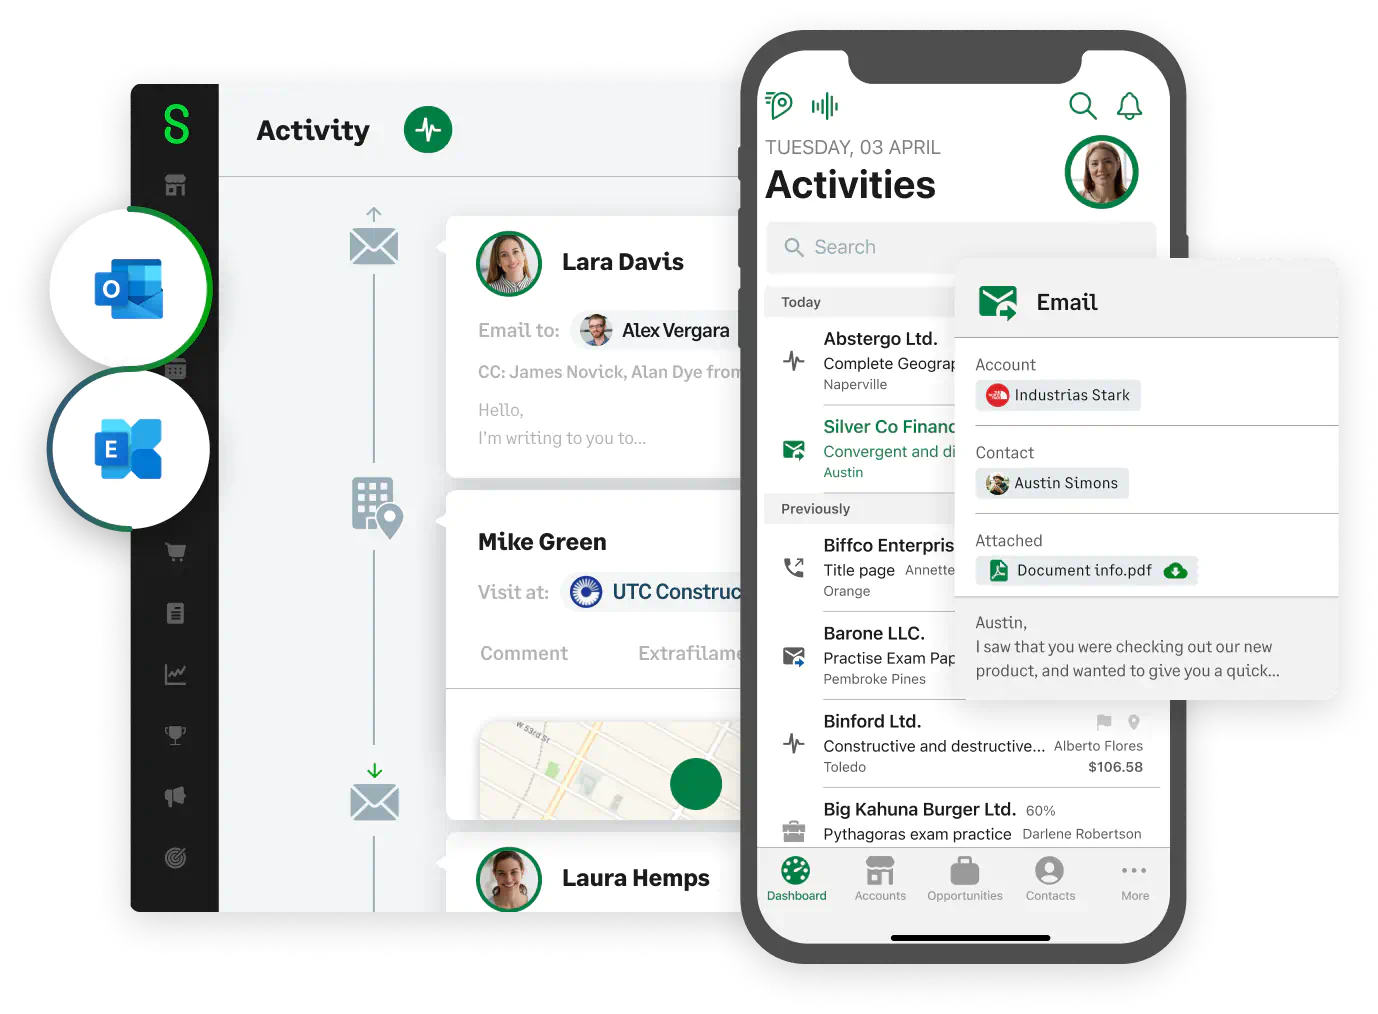
Synchronized with Outlook and Exchange
Sync your calendar and check your customer emails inside ForceManager.


Synchronized with Calendar, Email, ERP and the most used business apps
View all integrationsOur experience in helping B2B field sales teams is unique, have a look at what our customers are saying.
Healthcare
Construction
Medical Devices
Pharmaceutical
Manufacturing
“Our sales visits increased by over 50% since ForceManager's implementation and the forecasts look extremely positive for the future".
Read full story
“Our sales reps can make the most of their time, detect new opportunities and improve sales results."
Read full story
”ForceManager allows us to carry out cross-selling or up-selling actions that had led to a great improvement in the company results".
Read full story
“Our previous CRM was very dependent on internet coverage to log data and was extremely unstable due to network issues".
Read full story
“At first it seemed too good to be true. There was just so much that ForceManager was able to deliver. It’s safe to say ForceManager delivered".
Read full story
The sales software that accelerates the rhythm of your sales team
90%
Of your sales reps
will use it daily
+25%
Increase in sales activities
2h
Per week saved in reporting activities by each sales rep

Our specialists will help you easily get started with ForceManager. They’ll guide you along the journey of bringing your sales team to the next level.
Talk to our experts


